


.webp)


What is a Growth Chart?
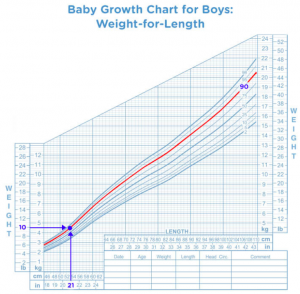
Growth charts show a series of percentile curves that show the distribution of body measurements in children as they grow. Pediatricians use growth charts to track the growth of your children and see how their growth compares to the growth of other children.
Who Creates the Standard Growth Curve?
- The World Health Organization (WHO) creates the growth chart most commonly used for infants and children ages 0 to 2 years of age in the U.S.
- The Center for Disease Control (CDC) creates the growth charts most commonly used for children age 2 years and older in the U.S.

What Do the Percentiles Mean?
The percentile shows how your child's measurements (usually weight, height, or body mass index) compares to other children of their same age and gender. For weight, it tells you what percentage of similar children weigh less than your child. For example if your child is in the 40th percentile for weight, then out of a sample of children of the same age and gender about 40% will weigh less than your child and about 60% will weigh more than your child.
How Do You Interpret Measurements on the Growth Curve?
Growth charts are used as a standardized tool to aid pediatricians understand your child's growth. The graph alone is not intended to be used on its own for diagnosing any issues- it contributes to forming an overall clinical impression for each child. Growth charts are one of the most important components of the overall assessment of children and help us to understand their nutrition, health, and well-being. Altered growth patterns can sometimes suggest an underlying health problem that needs to be investigated.
What is Measured for the Growth Curve
Weight and height are measured in order to determine the weight-for-length percentile for children under 2 years old and to determine the body mass index (BMI) for children over 2 years old. For young children, we also often look at head circumference measurements. It is very important to get accurate values to correctly interpret the meaning of the numbers.

Check out our other blog posts to understand the risk for being overweight or underweight. The standard growth chart may not be the correct tool if your child has a genetic syndrome or was born prematurely. Check out this blog post that discusses growth for those populations.


